News
Cooperation project on geo-mass data successfully completed
The collaborative project "Solar potential analysis and web visualisation of 3D geo-mass data using the example of the Munich urban region" in cooperation with a team led by Dr. Martin Behnisch from the Leibniz Institute for Ecological and Regional Development (IöR) was successfully completed.
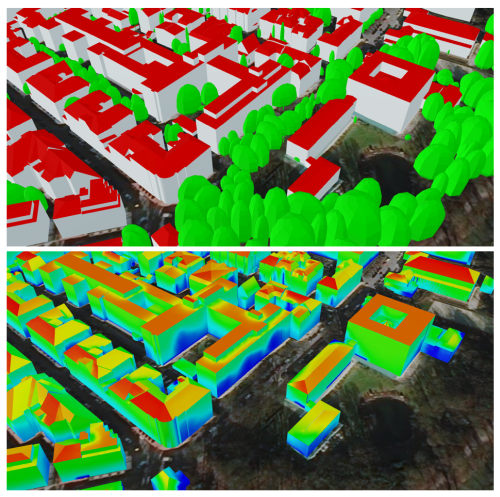
As part of the project initiated by the Runder Tisch GIS e.V. and the Bavarian State Office for Digitalisation, Broadband and Surveying (LDBV), a detailed vegetation model was created for the entire Munich urban area and then the solar irradiation was simulated in 3D on building facades and roofs.
The vegetation model was created by Markus Münzinger at the IöR and contains over 2.1 million vegetation objects. Each tree is defined by the trunk diameter, crown width and tree height and is represented in the CityGML city model with a geometry derived from these parameters, separated into coniferous and deciduous trees.
In addition to the vegetation model, the CityGML LoD2 building model and the DTM1 were included in the shading analysis to take into account mountain and valley locations within a radius of 20 km. The solar potential analysis tool was developed at the Chair of Geoinformatics of Prof. Thomas H. Kolbe under the supervision of Bruno Willenborg and colleagues. As part of the project, the tool was further developed for processing geomass data for use in the cloud. With the help of Docker Containers, the entire analysis workflow can now be rolled out in a Docker Swarm or Kubernetes cluster and scaled freely. Thanks to the performance gains achieved in this way, the simulation for the entire Munich urban area could be carried out in less than five days in its own small cluster of CIP pool computers at the chair that were unused due to Corona.
The online demo of the solar potential analysis Munich with over 300,000 buildings can be accessed at the URL below; the Google Chrome browser currently offers the best performance. The buildings are textured according to solar irradiation. Blue means little solar radiation, red means a lot of solar radiation. You can show or hide individual layers via the toolbox (top left). When clicking on a building, the radiation totals for the building are displayed in different time steps in kWh / year.
3D Web Client Munich: https://bit.ly/3pre9H1
The cloud-based solar potential analysis tool is also used in another cooperation project with the IöR. The "Standard-BIPV" project is concerned, among other things, with determining the photovoltaic potential on building façades for the whole of Germany. New figures from the project put the theoretical area potential on façades at 12,000 square kilometres, which is about half the area of Mecklenburg-Western Pomerania and twice the area potential of roofs. For their study, the researchers analysed a CityGML 3D building model from the Federal Agency for Cartography and Geodesy (BKG). In addition, detailed analyses were carried out in three focus areas, the cities of Munich, Freiburg and Dresden, as well as a nationwide sample of 100,000 buildings, for which the Chair's solar tool was used.
Further information on the "Standard BIPV" project can be found in this press release from the IöR and a radio report in the WDR science programme "Quarks" and this publication.